US DOLLAR TECHNICAL ANALYSIS – Prices slipped back below the 23.6% Fibonacci expansion at 10820, exposing the 14.6% level at 10772. A further push below that eyes the July 29 low at 10693. Alternatively, a move back above 10820 targets the 38.2% expansion at 10899.
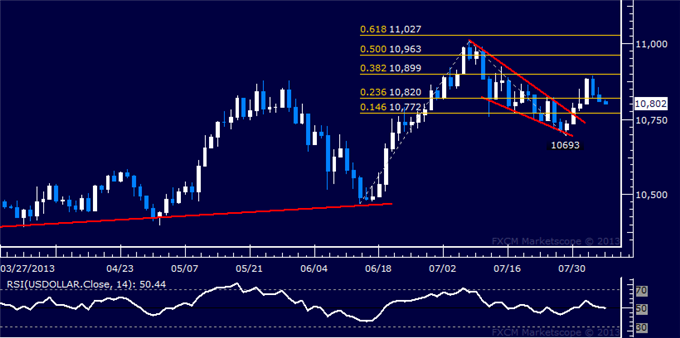
Daily Chart - Created Using FXCM Marketscope 2.0
** The Dow Jones FXCM US Dollar Index and the Mirror Trader USD basket are not the same product.
S&P 500 TECHNICAL ANALYSIS – Prices put in a Hanging Man candlestick below resistance at 1710.90, the 100% Fibonacci expansion, hinting at indecision and warning a turn lower may be ahead. Near-term support is at 1687.40, the May 22 high, followed by the 76.4% Fib at 1675.10. Alternatively, a break above resistance aims for the 123.6% Fib at 1746.70.
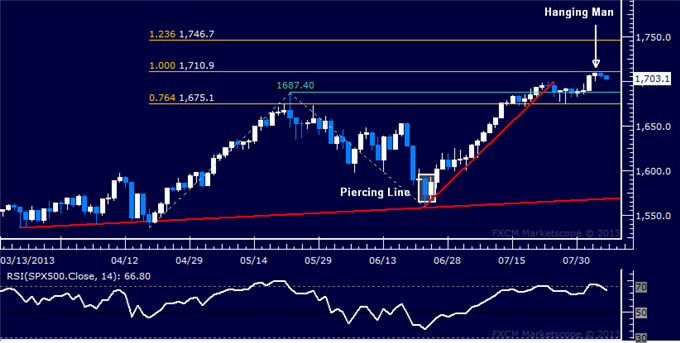
Daily Chart - Created Using FXCM Marketscope 2.0
GOLD TECHNICAL ANALYSIS – Prices broke lower as expected after putting in a Bearish Engulfing candlestick pattern below resistance at the top of a rising channel set from late June. Sellers are now challenging the 14.6% Fibonacci expansion at 1301.68, with a break below that exposing the 23.6% level at 1273.98. Channel bottom support-turned-resistance is now at 1341.47.
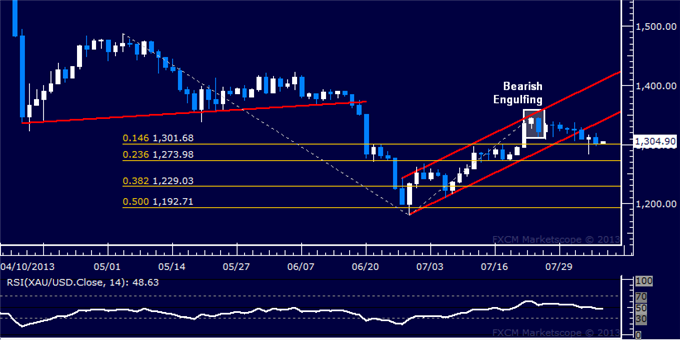
Daily Chart - Created Using FXCM Marketscope 2.0
CRUDE OIL TECHNICAL ANALYSIS– Prices advanced as expected after putting in a Bullish Engulfing candlestick pattern. A break above initial resistance at 106.49, the 23.6% Fibonacci expansion, has exposed the 38.2% level at 108.85. A further push above that aims for the 50% Fib at 110.77. The 106.49 mark has been recast as near-term support, with a reversal back beneath that eyeing the July 30 low at 102.66.
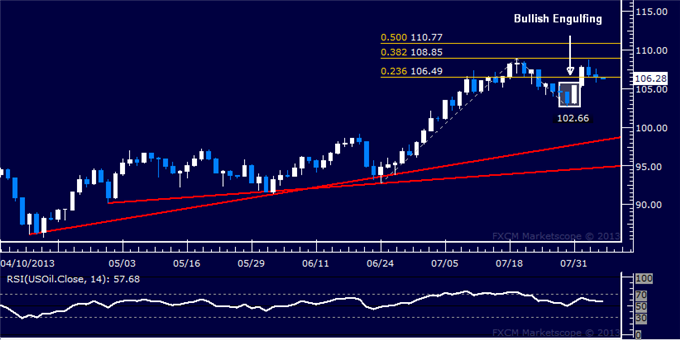
Daily Chart - Created Using FXCM Marketscope 2.0
No comments:
Post a Comment