Thursday, May 23, 2013

Nikkei 225 Futures Destroyed! 1000 Point Drop Overnight


Nikkei 225 Futures are down 1000! A 6.38% Decline, incredible!

Person's PPS thinkScript mod


I made a thinkScript modification of the PPS study on the ThinkorSwim desktop platform. Normally the PPS shows two proprietary "moving averages"?, with accompanying Buy and Sell Arrows.
I had the script Hide the MA's, and changed the show Arrow to a PaintingStrategy to where it would indicate the Price at the MA's crossover. Give me a shout if you'd like the script adjustment. Glad to share.

Fractals on ThinkorSwim


Here is my version of Bill Williams Fractals. To avoid redundancy, I omitted the arrows that would go alongside, above or below, price. They work incredibly well in combination with Williams Alligator study. Buy when Fractal above Jaw, Sell: Below Jaw. They work well with many other combos of studies, too. Give me a shout, if you'd like the thinkScript for them. Glad to share.

Woodies CCI thinkScript Optimized


The ThinkorSwim Desktop application includes Woodies CCI & Woodies Pivots, as available studies, without charge. Through their proprietary programming language thinkScript, they even let the users call up the study to modify it to their heart's content; as such, with the help of some genuinely kind-hearted souls, were it not for whom so very graciously donated their time and effort, in the thinkScript Lounge, we were able to make this one of the most powerful studies on the platform. The AddLabel script allowed us to denote the distance in pips (or ticks) from the underlying's current price to a prior candle's High & Low; Entire Chart Range's High & Low; Woodies Pivot, R1, & S1. So at any time, I know exactly how many ticks price has to travel to reach the Pivot (or whatever level I am interested in).

The final mod was also using the AddLabel script. This time we called up the 34 period EMA (Exponential Moving Average), and asked the study to tell us the degree of slope on the moving average between the prior candle and the current one. So after a parabolic rise in price, the indicator may read 74* degrees as it begins to flatten out from a steep angle. This is absolutely, without question, and by far my favorite study, now. It offers such a wealth of information, that with it applied to my preferred chart layout of 2x8 (two rows of 8 charts), I have to open another instance of ThinkorSwim desktop to place my trades without data bottlenecks/slowdown.

Legend:
Upper Graph
Magenta = Woodies Pivot Point, White = Distance in Ticks
Red = Woodies R1; White = Distance in Ticks
Green = Woodies S1; White = Distance in Ticks
Cyan = 34 Period EMA (exponential moving average) Slope* In Degrees

Lower SubGraph
Red H = 1 Candle Prior High; White = Distance in Ticks
Green L = 1 Candle Prior Low; White = Distance in Ticks
Red HH = Entire Chart Aggregation High; White = Distance in Ticks
Green LL = Entire Chart Aggregation Low; White = Distance in Ticks

Visit the contact page at www.dWbstreet.com for more information, &/or email dbeck@dWbstreet.com
The entire programming script add-on is posted at the Identity page, www.dWbstreet.com/Identity.php
as a text file, totally complimentary...Enjoy.

Wednesday, May 22, 2013

Abbott Labs Wave Count


Figure 1. Weekly chart of Abbott Labs with Elliott wave count.
Graphic provided by: AdvancedGET.


Figure 2. Daily Chart showing JM Internal Band.
Graphic provided by: AdvancedGET.

Morgan Stanley losing steam

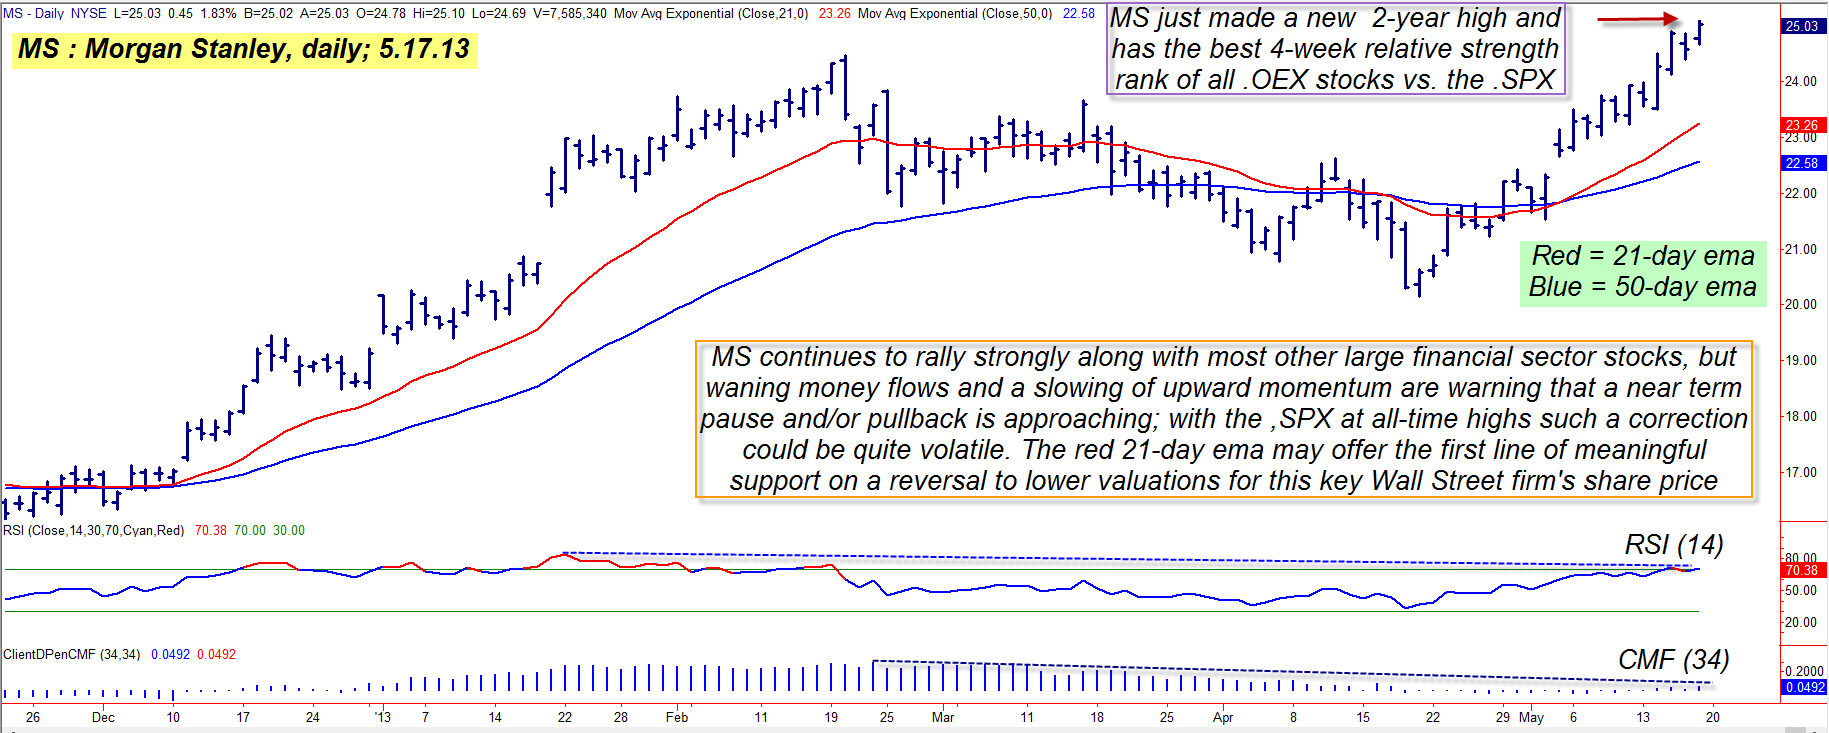
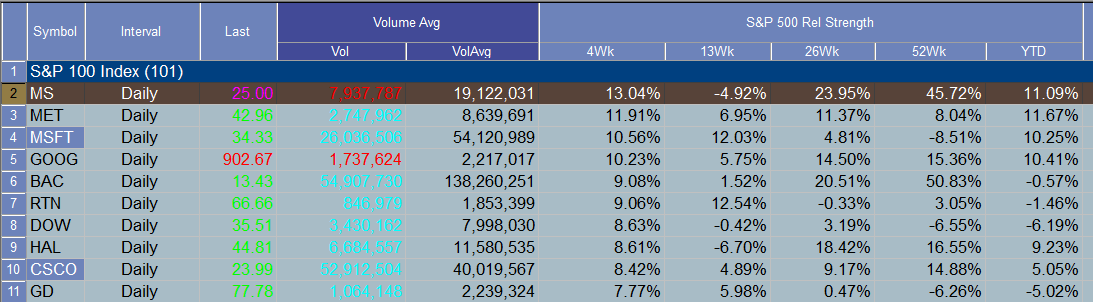
Figure 1: Morgan Stanley's weekly chart uptrend is still very bullish but on the daily time frame, MS appears to be losing major steam in terms of money flow trend and upward momentum.
Graphic provided by: TradeStation.
Figure 2: Morgan Stanley (MS) is substantially outperforming the S&P 500 index (.SPX) over the last 4-, 26-and 52-week periods. Financial sector stocks continue to push the .SPX higher, but expect a pullback within the next week or so.
Graphic provided by: TradeStation.
Graphic provided by: TradeStation Radar Screen.

AAPL Wave Count


Figure 1. Monthly Elliott wave count for Apple, Inc.
Graphic provided by: AdvancedGET.

Figure 2. Weekly Elliott wave count for Apple, Inc. with an MOB target.
Graphic provided by: AdvancedGET.

Figure 3: Daily chart of Apple, Inc. showing short-term targets.
Graphic provided by: AdvancedGET.

Planetary Alignments & Astro *Carto* graphy


Dollars & Cents

Dollars & Cents


The market had a lot to digest between Ben Bernanke testifying before Congress regarding his outlook on the U.S economy and the FOMC meeting minutes being released. Initially equities opened in positive territory until the news events indicated that the Fed could start to scale back its massive bond buying program as early as this fall. The news sent equities into negative territory while the dollar gained ground.

The EUR/USD was showing signs of strength until Ben Bernanke spoke. Indications are that the Fed will reduce the bond buying programs as equities continue to show strength. The reduction in bond purchasing is bullish for the dollar because it means the currency won't be devalued as much as previously anticipated. Meanwhile, Europe still struggles with exceptionally high unemployment underfunded banks which means unlike the Fed, the ECB doesn't have the luxury of cutting quantitative easing measures. (see EUR/USD below)


The USD/HKD failed to make a rally off of today's FOMC report but has yet to break short term support near 7.7590. As long as price holds above this level we will look for a rally and maintain the position. (see USD/HKD below)


The AUD/CAD is holding support despite the fact that both gold and oil sold off today which tends to add bearish pressure to this pair. Early Thursday morning the Chinese PMI will be released and any number above 50 should be bullish for the Aussie. (see AUD/CAD below)

Market LookBeck II

(Reuters) - The dollar rallied to a 4-1/2-year high against the yen and a near three-year peak against a currency basket on Wednesday after Federal Reserve Chairman Ben Bernanke stoked speculation the U.S. central bank could begin slowing its asset buying in coming months.

Bernanke, in testimony to Congress, said the Fed's massive bond-buying program would remain in place for now. But he added if economic improvement continued, the Fed could "in the next few meetings take a step down" in its purchases and warned that holding interest rates too low for too long has its risks.

The dollar initially sold off after Bernanke said monetary stimulus is helping the U.S. economy recover and it was too soon to remove existing measures. It then rebounded and surged to the day's highs as traders focused on the possibility of the Fed reducing its bond buying later this year.

"The takeaway from his speech is clear which is that the Fed is serious about winding down QE and all of the speculation surrounding this possibility is validated," said Kathy Lien, Managing Director of FX Strategy for BK Asset Management in New York.

"The U.S. dollar has been on a tear since the beginning of the month and should extend its gains now that Bernanke green-lighted the rally."

The dollar has risen more than 5 percent so far this year against a basket of currencies on expectations the beginning of the end of the Fed's bond-buying program might come sooner than many investors think.

But those hopes faded somewhat this week after several Fed officials dampened speculation the Fed may change its policy stance any time soon.

The dollar rose to a session peak of 103.73 yen, according to Reuters data, the highest since October, 2008. It was last up 0.7 percent on the day at 103.21 yen.

Against a basket of currencies, the dollar index rose to 84.422, the highest since July 2010. It was last at 84.319, up 0.54 percent on the day.

The euro slipped 0.4 percent to $1.2862, retreating from a one-week high of $1.2998 set before Bernanke's speech.

In a sign of divisions on the policy-setting Federal Open Market Committee, minutes of the latest meeting released Wednesday highlighted an active debate over how soon the Fed should start to scale back its bond-buying stimulus.

SWISSIE A FOCUS

The euro hit a two-year high against the Swiss franc of 1.2648 francs after Swiss National Bank chief Thomas Jordan did not rule out negative interest rates and said policymakers could adjust the euro/franc currency cap if necessary. It was last at 1.2601, up 0.7 percent.

The U.S. currency climbed to a nine-month peak against the Swiss franc of 0.9838 franc, and was last at 0.9795 franc, up 1 percent on the day.

UBS said its forecasts for the euro/Swiss franc and the dollar/Swiss franc are 1.27 and 0.99 in three months' time but there are upside risks to its targets.

The euro hit a 3-1/2-year high of 133.77 yen, before pulling back to 132.70 yen, up 0.3 percent on the day. So far this year, it has gained 16 percent.

Traders said the yen was likely to come under more pressure once outflows gather pace from Japanese investors seeking higher yields overseas.

The Bank of Japan kept policy steady on Wednesday, as expected, and upgraded its assessment of the economy.

Governor Haruhiko Kuroda said he did not expect long-term rates to spike given the scale of the BOJ easing and reiterated that there was no change in the goal of achieving 2 percent inflation.

"The (Abe) administration is looking for further yen weakness, but we think the pace will slow," said Chris Walker, currency strategist at Barclays in London.

Sterling fell to a two-month low against the dollar after an unexpectedly sharp drop in retail sales sparked concerns the Bank of England could opt for more monetary easing in the coming months.

Market LookBeck

Dow Jones Industrial Average 15307.17 -80.41 -0.52%
S&P 500 Index 1655.35 -13.81 -0.83%
Nasdaq Composite 3463.29 -38.82 -1.11%
Nasdaq 100 2999.12 -27.32 -0.90%
Russell 2000 982.25 -16.52 -1.65%
Spot Gold 1366.27 -12.41 -0.90%
Crude Oil 94.06 -1.77 -1.85%
NYSE Overall Volume 4,315,841K n/a 23.98%
Nasdaq Overall Volume 2,160,169K n/a 22.18%
NYSE Breadth 3.55 : 1 negative
Nasdaq Breadth 3.76 : 1 negative
NYSE Breadth Ratio 21.98
Nasdaq Breadth Ratio 21.03
NYSE Advancers/Decliners -1718
Nasdaq Advancers/Decliners -1182
NYSE Trin 0.98
Nasdaq Trin 1.30
$VIX 13.82 0.45

MONTHLY - Bullish - Fifth consecutive bullish monthly bar close with higher high.

WEEKLY - Bullish - Fourth straight week with large body candle.

DAILY - Bearish - Expansion of range taking out multiple lows. Target 1637.

                                       ES
                       NQ
Value Area High 1685.75 3052.75
Point of Control 1677.25 3034.00
Value Area Low 1658.25 3003.25
R3 1717.92 3111.50
R2 1701.83 3082.50
R1 1678.67 3041.75
Pivot 1662.58 3012.75
S1 1639.42 2972.00
S2 1623.33 2943.00
S3 1600.17 2902.25

ShadowTrader Sector Trend Scores


Twenty two of twenty five ShadowTrader Sectors closed lower on Wednesday. The three sectors that closed higher were $DJSINS. DRG, and GOX. XAL closed lower for the fifth consecutive day bringing it into oversold territory.

Market Focus May 23

Thursday, May 23, 2013


Weekly Bill Settlement

James Bullard Speaks6:05 AM ET

Jobless Claims
[Report][Star]
8:30 AM ET


New Home Sales
[Report][Star]
10:00 AM ET


10-Yr TIPS Auction
[Bullet
1:00 PM ET

Fed Balance Sheet
[Bullet
4:30 PM ET

Money Supply
[Bullet
4:30 PM ET

FOMC Minutes

FOMC Minutes
Released On 5/22/2013 2:00:00 PM For 5/22/2013 2:00:00 PM
Highlights
Concerned about upside risks to inflation, a number of hawks at the FOMC meeting earlier this month were willing to begin tapering down asset purchases as early as June with one hawk calling for an immediate tapering.

But the hawks were outnumbered as the doves called for more progress on the economy before slowing the pace of asset purchases. The doves argued that the nation's recovery, which started strong, was beginning to slow, with one dove arguing that more accommodation, not less, was needed. Most members at the meeting were willing to make adjustments to purchases, whether up or down, based on the jobs market and inflation.

Pointing to rising issuance of lower quality bonds, hawks voiced concern that US financial markets were becoming too buoyant. Comments were also heard that the Fed, as part of its quantitative easing effort, should begin moving to Treasury purchases and away from purchases of mortgage-backed securities.

The Dow, suddenly sinking slightly into the red, is reacting to the hawkish elements in today's minutes. But the bulk of the committee is cautious to remove stimulus, at least for now as voiced today by Chairman Bernanke in his Washington testimony.
Definition
The Federal Open Market Committee issues minutes of its meetings with a lag. The minutes of the previous meeting are reported three weeks after the meeting.  Why Investors Care
 
2013 Release Schedule
Released On:1/32/204/105/227/108/2110/911/20
For Policy Statement On:12/121/303/205/16/197/319/1810/30

Existing Home Sales

Existing Home Sales
Released On 5/22/2013 10:00:00 AM For Apr, 2013
PriorConsensusConsensus RangeActual
Existing Home Sales - Level - SAAR4.920 M5.00 M4.91 M to 5.10 M4.97 M
Existing Home Sales - M/M Change-0.6 %0.6 %
Existing Home Sales - Yr/Yr Change10.3 %9.7 %
Highlights
Activity in the housing sector caught fire in April with existing home sales up 0.6 percent to an annual rate of 4.97 million. Sales of single-family homes, the most important component in the report, rose 1.2 percent in the month.

Supply, which had been very tight, poured into the market during April with 230,000 units added to lift the months supply to 5.2 from 4.7 months. The median time for a house on the market fell dramatically, to 46 days vs 62 days in March.

And sellers are getting their price based on the report's price data. After jumping 6.2 percent in March, the median price rose another 4.8 percent in April to $192,800 which is the highest level of the recovery. Note that price data in this report, which are not based on repeat transactions, are often volatile. Still, a double digit year-on-year median gain at 11.0 percent is convincing.

Regional data, like they have all year, show little variation with three regions posting low single-digit monthly gains and one a low single-digit dip. But the report notes that a 1.7 monthly sales rise in the West is a notable positive given how low supply is in the region.

Sales of existing homes appear to have hit stride nicely in the opening of Spring. Yet a threat right now, at least for May sales, is that mortgage rates are suddenly on the rise this month and in a big way, making for big and sudden declines in mortgage activity as seen in the weekly MBA Purchase Applications report posted earlier this morning on Econoday.
Market Consensus before announcement
Existing home sales for March came in at a 4.92 million rate, down 0.6 percent from February. The March decline followed gains in January and February of 0.8 percent and 0.2 percent. The latest reading left sales 10.3 percent above year-ago levels. Total supply at the March sales rate was 4.7 months which is up, but only slightly, from 4.6 months in February. Supply in March 2012 was 6.2 months. Only 30,000 units were added to inventory in the month versus an average March increase of 100,000 units. A reduction in distressed properties may be a factor limiting supply.
Definition
Existing home sales tally the number of previously constructed homes, condominium and co-ops in which a sale closed during the month. Existing homes (also known as home resales) account for a larger share of the market than new homes and indicate housing market trends. (National Association of Realtors)  Why Investors Care
 
[Chart]
Existing home sales reached a peak in mid-2005 and have been easing since. Typically, a distinct reverse relationship exists between home sales and mortgage rates. However, sales and mortgage rates both have firmed in recent months.
Data Source: Haver Analytics
 
2013 Release Schedule
Released On:1/222/213/214/225/226/207/228/219/1910/2111/2012/19
Release For:DecJanFebMarAprMayJunJulAugSepOctNov

Fibonacci Ticks 144-6765 /6E


dWbShadowTrader Quad


Fibonacci Ticks 144-6765 /ES


Are You Watching This Major Warning Sign For S&P 500 Top?

SummaryThe Australian Dollar (ticker: FXA) has tumbled despite record-highs in the S&P 500 (ticker: SPY). Is the Aussie currency the canary in the coal mine, and does it point to a big S&P pullback?
Strong bull markets in stocks have historically coincided with Australian Dollar(ticker: FXA)strength,and indeed the 2009 lows in the S&P 500 (ticker: SPY) occurred almost exactly as the AUDUSD established a lasting bottom. Yet a critical divergence suggests a key S&P top may be near.
Last week we highlighted the fact that the sharp divergence between AUDUSD and S&P 500 could partly be explained by a sharp drop in Australian yields (ticker: AUD). But nothing moves in a vacuum—we can’t ignore the same factors that move yields should be the factors that move equity markets. Indeed, we argue that abigger correction in bond markets (ticker: TLH) could be a major catalyst to spark a much larger US Dollar rally.
The question becomes simple: is the Australian Dollar the so-called “canary in the coal mine”? Or in simpler terms, does the Australian Dollar sell-off point to an imminent correction in stocks?
Australian Dollar Plotted Against Relative Moves in S&P 500, Gold (ticker: GLD)
australian_dollar_and_the_s_and_p_500_body_Chart.png, Are You Watching This Major Warning Sign For S&P 500 Top?
Data source: Bloomberg, Chart source: R
We’re big fans of Dow Theory here at DailyFX, a set of six basic rules derived by Charles Dow that date back nearly 120 years. One of the most important rules is “Stock market averages must confirm each other.” And though we’re talking about currencies and stocks, we feel it’s still relevant here. In fact, our Senior Technical Strategist pointed out a critical divergence between EURUSD (ticker: FXE) and USDCHF (ticker: FXF) that preceded the substantial EURUSD sell-off and USDCHF surge.
The fact that the S&P 500 (and broader global equity indices) are hitting record-peaks as the Australian Dollar and commodity markets sell off sharply is a major warning sign. But it’s likewise clear that the only factor that really matters in trading is time.
We’re probably right in calling for a potentially significant S&P 500 pullback, but the critical question is “When?” If it happens after the S&P rallies another 100 big points, we won’t be in a great position to take advantage. Let’s see if trader sentiment can give us some clues. We’ll start with the Australian Dollar:
Retail Sentiment Favors Continued Australian Dollar Weakness
australian_dollar_and_the_s_and_p_500_body_Picture_2.png, Are You Watching This Major Warning Sign For S&P 500 Top?
Data source: FXCM Execution Desk, Weekly Sentiment Table
It’s rare that we use such hyperbole in our research, but we recently wrote “Australian Dollar Direction Couldn’t Be Any More Clear” as the number of retail traders long AUDUSD recently hit record-highs. We use our proprietary Speculative Sentiment Index data as a contrarian signal to price action: if everyone’s long, we like to sell and vice versa. Such incredibly one-sided sentiment leaves us plainly in favor of continued Aussie Dollar declines. What about the S&P?
Retail CFD Speculators Are Extremely Short SPX500
australian_dollar_and_the_s_and_p_500_body_Picture_3.png, Are You Watching This Major Warning Sign For S&P 500 Top?
This one requires a bit of a leap of faith: retail CFD speculators are essentially their most short the SPX500 contract on record. But—and this is an important caveat—we’ve recently seen a noteworthy build in crowd buying. According to our sample of retail traders, the number of long orders has surged by nearly 60 percent in the past 30 days.
In the interests of full disclosure, we made the same observation in Thursday’s weekly SSI report and yet the SPX500 has moved to fresh highs. Yet we’ll once again defer to Dow Theory—there are three phases in market trends: accumulation, public participation, and distribution.
In plain English, a trend begins as traders “in the know” accumulate (buy) shares/currencies/whatever and push price higher. The second phase is when the public sees the trend and rushes to buy so as not to miss the “obvious” profit opportunity—Elliott Wave fans might call this a “Wave 5”. The third phase is simple enough: the market trend comes to a potentially violent end as everyone rushes for the exits.
Our proprietary retail speculative sentiment data warns that we might be in Phase 2 of this S&P 500 move as the public finally shows itself willing to buy into record peaks. We’re speaking in terms of Dow Theory, but it could just as easily be explained in any terms you like—once the crowd gets involved we’re almost certainly closer to the top than the bottom.
Another few factoids worth considering: the S&P 500 rally has been its most consistent since important March, 2012 peaks and other key market tops. All the while, a key break higher in Australian Dollar volatility pricessuggests the AUDUSD may have considerably more room to fall.
Is the Australian Dollar the canary in the coal mine? Certainly S&P 500 bulls might want to reconsider their portofolio weights given that typically-correlated markets such as the AUD or even Gold/Crude Oil/other commodities fail to hit similar peaks.
Forex Correlations SummaryView forex correlations to the S&P 500, S&P Volatility Index (ticker: VXX), Crude Oil (ticker: USO) Futures prices, US 2-Year Treasury Yields (ticker: SHY), and Spot Gold prices in the past 30 days:
australian_dollar_and_the_s_and_p_500_body_Picture_4.png, Are You Watching This Major Warning Sign For S&P 500 Top?

Market Top?


Dow Since 1900