Summary: The Australian Dollar (ticker: FXA) has tumbled despite record-highs in the S&P 500 (ticker: SPY). Is the Aussie currency the canary in the coal mine, and does it point to a big S&P pullback?
Strong bull markets in stocks have historically coincided with Australian Dollar(ticker: FXA)strength,and indeed the 2009 lows in the S&P 500 (ticker: SPY) occurred almost exactly as the AUDUSD established a lasting bottom. Yet a critical divergence suggests a key S&P top may be near.
Strong bull markets in stocks have historically coincided with Australian Dollar(ticker: FXA)strength,and indeed the 2009 lows in the S&P 500 (ticker: SPY) occurred almost exactly as the AUDUSD established a lasting bottom. Yet a critical divergence suggests a key S&P top may be near.
Last week we highlighted the fact that the sharp divergence between AUDUSD and S&P 500 could partly be explained by a sharp drop in Australian yields (ticker: AUD). But nothing moves in a vacuum—we can’t ignore the same factors that move yields should be the factors that move equity markets. Indeed, we argue that abigger correction in bond markets (ticker: TLH) could be a major catalyst to spark a much larger US Dollar rally.
The question becomes simple: is the Australian Dollar the so-called “canary in the coal mine”? Or in simpler terms, does the Australian Dollar sell-off point to an imminent correction in stocks?
Australian Dollar Plotted Against Relative Moves in S&P 500, Gold (ticker: GLD)
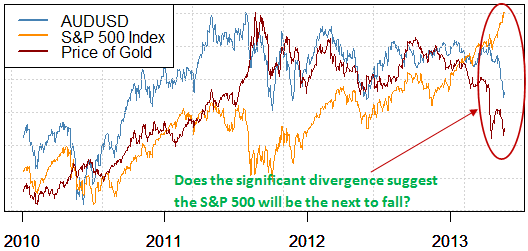
Data source: Bloomberg, Chart source: R
We’re big fans of Dow Theory here at DailyFX, a set of six basic rules derived by Charles Dow that date back nearly 120 years. One of the most important rules is “Stock market averages must confirm each other.” And though we’re talking about currencies and stocks, we feel it’s still relevant here. In fact, our Senior Technical Strategist pointed out a critical divergence between EURUSD (ticker: FXE) and USDCHF (ticker: FXF) that preceded the substantial EURUSD sell-off and USDCHF surge.
The fact that the S&P 500 (and broader global equity indices) are hitting record-peaks as the Australian Dollar and commodity markets sell off sharply is a major warning sign. But it’s likewise clear that the only factor that really matters in trading is time.
We’re probably right in calling for a potentially significant S&P 500 pullback, but the critical question is “When?” If it happens after the S&P rallies another 100 big points, we won’t be in a great position to take advantage. Let’s see if trader sentiment can give us some clues. We’ll start with the Australian Dollar:
Retail Sentiment Favors Continued Australian Dollar Weakness
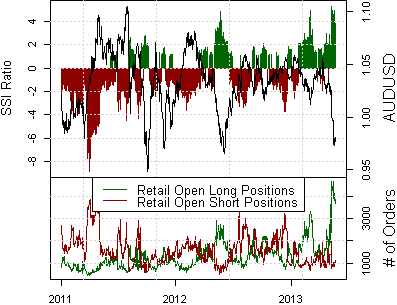
Data source: FXCM Execution Desk, Weekly Sentiment Table
It’s rare that we use such hyperbole in our research, but we recently wrote “Australian Dollar Direction Couldn’t Be Any More Clear” as the number of retail traders long AUDUSD recently hit record-highs. We use our proprietary Speculative Sentiment Index data as a contrarian signal to price action: if everyone’s long, we like to sell and vice versa. Such incredibly one-sided sentiment leaves us plainly in favor of continued Aussie Dollar declines. What about the S&P?
Retail CFD Speculators Are Extremely Short SPX500
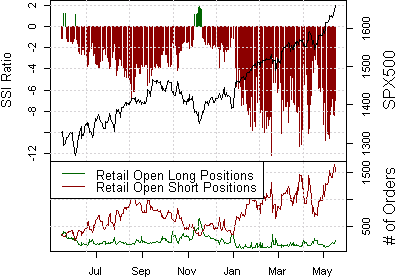
This one requires a bit of a leap of faith: retail CFD speculators are essentially their most short the SPX500 contract on record. But—and this is an important caveat—we’ve recently seen a noteworthy build in crowd buying. According to our sample of retail traders, the number of long orders has surged by nearly 60 percent in the past 30 days.
In the interests of full disclosure, we made the same observation in Thursday’s weekly SSI report and yet the SPX500 has moved to fresh highs. Yet we’ll once again defer to Dow Theory—there are three phases in market trends: accumulation, public participation, and distribution.
In plain English, a trend begins as traders “in the know” accumulate (buy) shares/currencies/whatever and push price higher. The second phase is when the public sees the trend and rushes to buy so as not to miss the “obvious” profit opportunity—Elliott Wave fans might call this a “Wave 5”. The third phase is simple enough: the market trend comes to a potentially violent end as everyone rushes for the exits.
Our proprietary retail speculative sentiment data warns that we might be in Phase 2 of this S&P 500 move as the public finally shows itself willing to buy into record peaks. We’re speaking in terms of Dow Theory, but it could just as easily be explained in any terms you like—once the crowd gets involved we’re almost certainly closer to the top than the bottom.
Another few factoids worth considering: the S&P 500 rally has been its most consistent since important March, 2012 peaks and other key market tops. All the while, a key break higher in Australian Dollar volatility pricessuggests the AUDUSD may have considerably more room to fall.
Is the Australian Dollar the canary in the coal mine? Certainly S&P 500 bulls might want to reconsider their portofolio weights given that typically-correlated markets such as the AUD or even Gold/Crude Oil/other commodities fail to hit similar peaks.
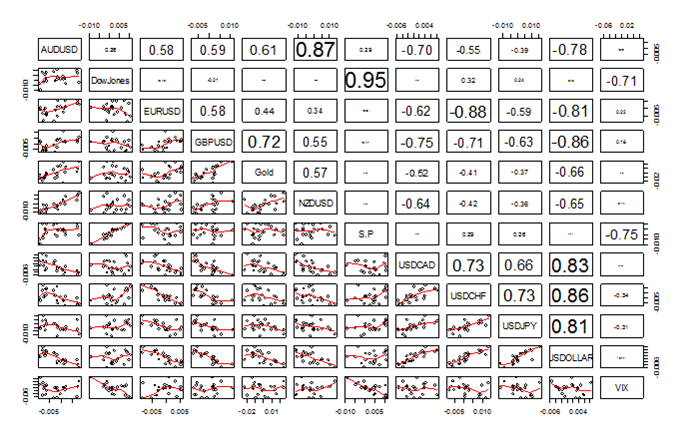
Forex Correlations SummaryView forex correlations to the S&P 500, S&P Volatility Index (ticker: VXX), Crude Oil (ticker: USO) Futures prices, US 2-Year Treasury Yields (ticker: SHY), and Spot Gold prices in the past 30 days:
No comments:
Post a Comment