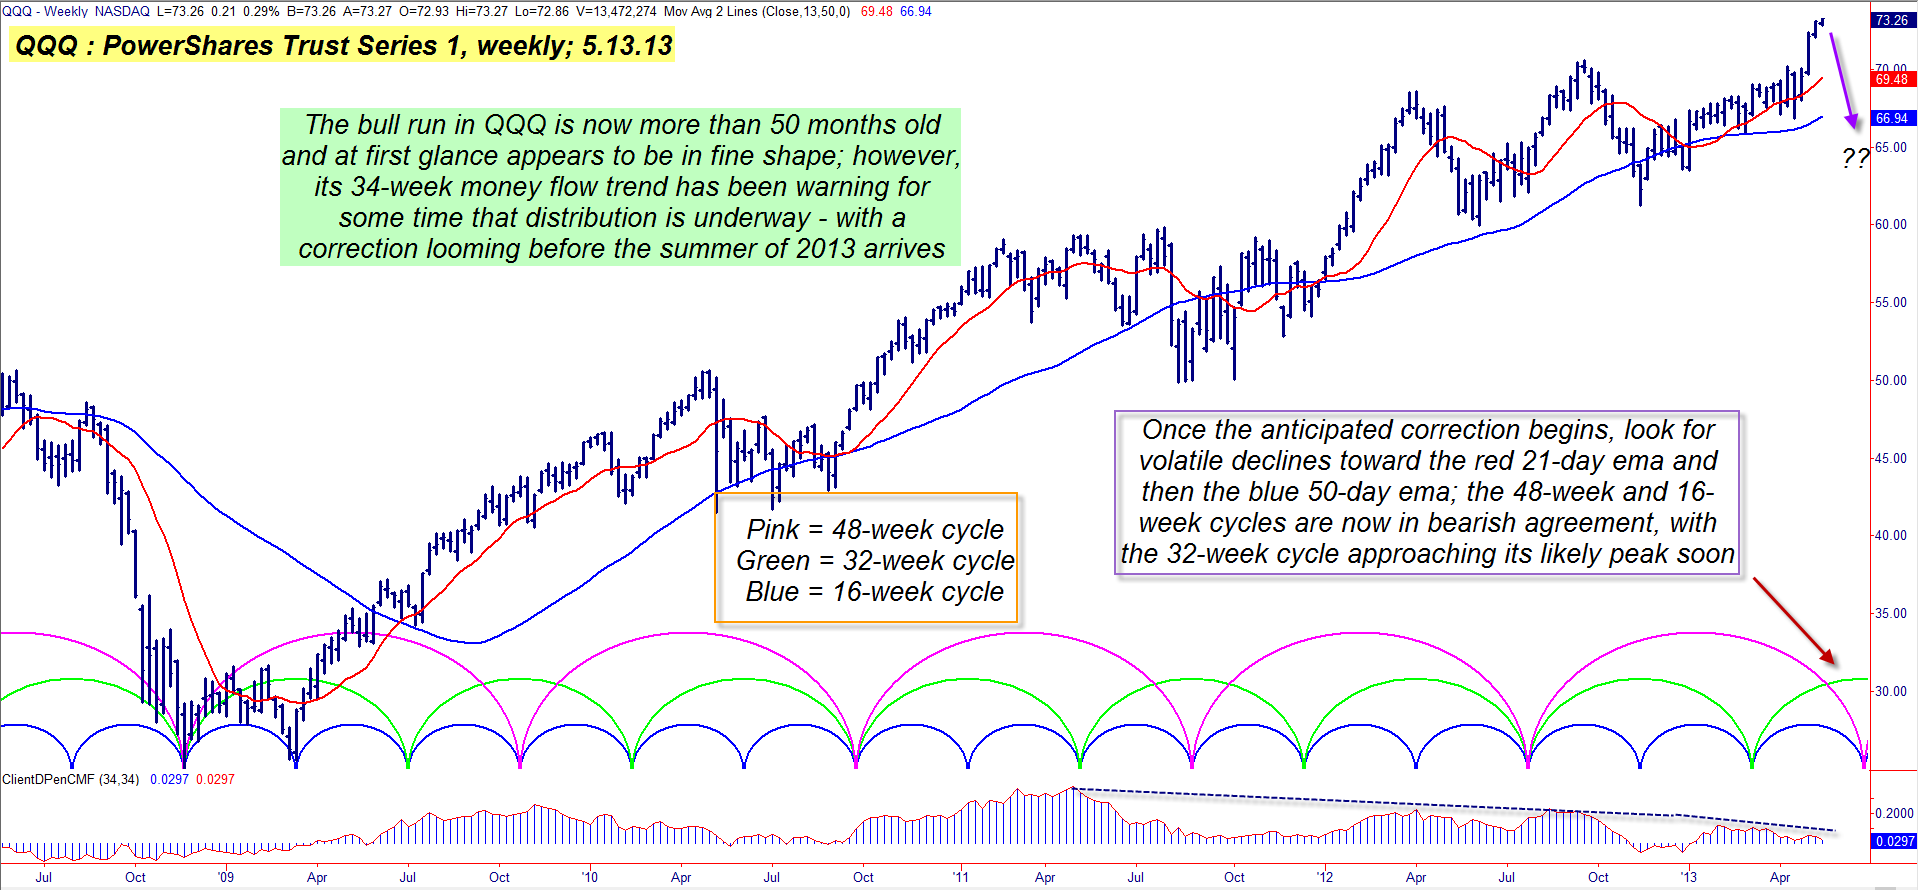
The Invesco PowerShares Trust (Series 1), the ETF that tracks the Nasdaq 100 index, bottomed in two stages back in late 2008/early 2009; the first low was the deepest, finally finding support at a price of 25.05 during the third week of November 2008; a second major low formed during the second week of March 2009, with QQQ making a higher low at a price of 25.63 (Figure 1). From this important double bottom pattern was birthed a rally that produced gains close to 200% (actually 192.70% as of Monday May 13, 2013); note how the QQQ has managed to stay well above its blue 50-day exponential moving average (EMA) for most of the months that have passed since June 2009 and that its slope has also spent most of its time pointing in an ever-higher direction. Truly, this has been a bull market of major historic value, but what traders/investors need to discern now is how to position their portfolios just in case the QQQ decides to take a breather over the next number of months. Looking at the 34-week Chaikin Money Flow histogram (CMF)(34), we find that a pattern of long-term distribution has been underway for at least the past eight to ten months, even as the QQQ has gone on to make new swing highs (which are also multiyear highs). Essentially, the lower peaks on the histogram tells us that the more recent rally phases have been marked by less volume, with smaller traders doing more of the "heavy lifting" than usual as institutional buyers gradually reduced their long exposure in this ETF. Taking a look at a different technical dynamic, we also find that the QQQ has maintained a fairly reliable 16- and 32-week price cycle (blue and green arcs, respectively) since the November 2008 lows; there is also a 48-week cycle (pink arc) at work that is also of great interest right now; both the 16-week and 48-week cycles are suggesting an imminent downturn in QQQ, with the 32-week cycle at or very near its anticipated zenith. Given the recent six-month rally in QQQ, this is a great time for those traders with significant long Nasdaq 100 stock exposure to either invest in some put option protection or to begin to scale out of some of their better-performing stocks over the next few weeks.
|
No comments:
Post a Comment