Wednesday, August 7, 2013

SPX Daily Near-Term Trendlines

SPX Daily Near-Term Trend Channels / Pivots

Closer Look

SPX Daily Intermediate Trendlines

Daily S&P Charts

Intermediate-Term Trend / Pivot Lines

Closer Look

SPX Weekly Technicals

S&P Weekly Charts

Weekly Intermediate-Term Trend Lines and Candlestick Analysis

Closer Look

SPX Weekly Fibonacci Extension Chart

SPX Weekly Round Top

SPX Weekly Measured Move

SPX Weekly Pennant

SPX Monthly Technicals

SPX Monthly Trend Lines and Candlestick Analysis

Closer Look

SPX Monthly Symmetrical Triangle

SPX Monthly Inverted Head and Shoulders

Market Look'Beck'

Under The Hood

When we say "under the hood" we mean market internals, ie: what was really happening behind the scenes. ShadowTraders who listen to our daily broadcast every day live on the thinkorswim platform know that all closing figures on the major averages should only be interpreted in the context of market internals. Look for convergences and divergences in the breadth, a/d line, and trin figures below to either confirm or cast doubt on what all those talking heads on TV are telling you.

Dow Jones Industrial Average 15518.74 -93.39 -0.60%
S&P 500 Index 1697.37 -9.77 -0.57%
Nasdaq Composite 3665.76 -27.18 -0.74%
Nasdaq 100 3122.19 -20.98 -0.67%
Russell 2000 1052.13 -10.87 -1.02%
Spot Gold 1282.61 -21.26 -1.63%
Crude Oil 105.65 -0.88 -0.83%
NYSE Overall Volume 3,095,556K n/a 23.59%
Nasdaq Overall Volume 1,528,400K n/a 4.75%
NYSE Breadth 3.45 : 1 negative
Nasdaq Breadth 2.99 : 1 negative
NYSE Breadth Ratio 22.48
Nasdaq Breadth Ratio 25.04
NYSE Advancers/Decliners -1505
Nasdaq Advancers/Decliners -975
NYSE Trin 1.16
Nasdaq Trin 1.27
$VIX 12.72 0.88

Looking Ahead


Market Outlook - Check here daily for the current S&P 500 Monthly, Weekly, and Daily bias.

MONTHLY - Bullish. Expansion of range made July bar large with a new all time high.

WEEKLY - Bullish. S&P 500 Index Weekly bar closing at new all-time high.

DAILY - Bearish to Neutral. Small pullback in broad market which could lead to support at 1688.00 in SPX which is the rising 20 SMA on the daily.
Good morning traders. In the Sector Trend Scores section below, we note the broad market is nearly oversold. A lower close today will put the market in this condition. This is one of the reasons we believe the S&P 500 Index (SPY) will find support at its twenty day simple moving average. Please observe the chart below.


The green line illustrates the twenty day simple moving average which closed at 168.75 yesterday. This level ties in with the prior five day consolidation area circled in blue.
These technical points along with Sector Trend Scores oversold projection, and the fact that large sellers did not participate in yesterday's pullback leads ShadowTrader Swing Trader to believe the market is not done moving higher.

Market Profile and Pivot Points for ES and NQ for Wednesday


                                       ES
                        NQ
Value Area High 1694.50 3122.00
Point of Control 1692.50 3116.50
Value Area Low 1690.50 3108.50
R3 1711.83 3164.08
R2 1706.17 3150.17
R1 1700.08 3134.08
Pivot 1694.42 3120.17
S1 1688.33 3104.08
S2 1682.67 3090.17
S3 1676.58 3074.08

ShadowTrader Sector Trend Scores


Twenty four of twenty five ShadowTrader Sectors closed lower on Tuesday. Two sectors, $DJUSRE and GOX, both closed lower for the seventh consecutive day. The broad market is now on the cusp of being oversold.

Tuesday, August 6, 2013

Woodies CCI thinkScript Available for Import

Over at www.dWbstreet.com, on the 'Introduce' page, there are several new indicators available for Import into thinkorSwim by TDAmeritrade. The current set is part of a Combined Signal Trading Algorithm (CSTA) developed with Woodies CCI as the foundation. Please check out the prior Youtube clip, 'Woodies CCI thinkScript Optimized,' that explains the nuts and bolts of the modified combination of studies. There will be more CSTA's added to the site in the near future-- for a complete list of available studies, strategies, scans, & watchlists, Please contact us through the same page where you find the thinkScript.

This is the page you will be arriving at...


Please demo one of my personal favorites--Customized in thinkScript for thinkorSwim by TDAmeritrade.
To Import these studies into thinkorSwim, simply right-click on a file, choose save link as, choose desktop or your preferred folder and repeat for each one listed below. Then, open thinkorSwim, go to edit studies, choose Import, and add the files you saved below. If you have any difficulties, I will post a Youtube video, re-iterating the process, below. For additional Combined Signal Trading Algorithms, or more information, Please contact us.

Major Currency Pairs

(Reuters) - The dollar dropped for a third session against the yen on Tuesday, hitting a six-week low, as the greenback continued to be weighed by lowered expectations that the Federal Reserve would start reducing its bond purchases in the near term.

The U.S. currency has been weakening in the aftermath of below-forecast U.S. jobs data last Friday that prompted some analysts to push back expectations of when the Fed would begin slowing its bond-buying stimulus of $85 billion per month.

The Fed's asset-purchase program, called quantitative easing, is negative for the dollar as it is tantamount to printing money.

Expectations that the Bank of Japan, at its monthly policy meeting this week, will refrain from embarking on more stimulus measures also favored the yen.

"While the weakness of the dollar is pronounced against the yen, it is a broad sell-off that has more to do with Fed policy than BoJ policy," said Charles St-Arnaud, foreign exchange strategist at Nomura Securities in New York.

"This is symptomatic of how trading has been all summer, with so much volatility and people looking to lock in profits whenever they can," he said.

The dollar fell as low as 97.51 yen, its lowest since June 26. It last traded down 0.6 percent at 97.74 yen.

The Bank of Japan's next policy meeting is on Wednesday and Thursday, and BofA Merrill Lynch, in a global research report, said they do not expect it to make any changes to its policy framework.

The BoJ might need to consider additional easing if downside risks increase for the economic growth and inflation outlook, if doubts arise about the effects of its quantitative and qualitative easing, and if overseas economies falter and the yen appreciate, the bank said.

The euro, meanwhile, gained against the U.S. dollar on Tuesday on news of a surge in factory output in Britain and Germany, extending a string of recent upbeat data that perhaps points to an early end to the euro zone's 18-month recession.

While the euro zone single currency was buoyed by strong growth at factories in Germany - Europe's largest economy - and in Britain - the euro zone's biggest trade partner, most analysts believe the region significantly lags the kind of recovery under way in the United States.

The euro rose as high as $1.3323 and last traded at $1.3304, up 0.4 percent on the day.

The dollar briefly pared losses versus the yen and euro after data showed the U.S. trade deficit narrowed sharply in June to its lowest in more than 3-1/2 years as imports reversed the prior month's spike, suggesting an upward revision to second-quarter economic growth.

The dollar index was down 0.2 percent on the day at 81.687, according to Reuters data.

The Australian dollar, meanwhile, also rose against the dollar, gaining after the Reserve Bank ofAustralia cut interest rates as expected and gave no clear indication it would ease policy further, disappointing some who had positioned for it.

The RBA lowered its cash rate by a quarter percentage point to a record low of 2.5 percent, a cut which was fully factored in. Some had geared up for a 50-basis-point cut and some form of forward guidance or pledge to keep rates low, analysts said.

A squeeze in short positions saw the Australian dollar rise 0.7 percent to $0.9006, pulling away from a three-year low of $0.8848 struck on Monday. It has risen for two days and was on track for its best daily performance in two weeks.

While the Aussie last traded at $0.8962, up 0.4 percent on the day, some view the Aussie's gains as temporary.

The Aussie is likely to be pressured in the medium term by slowing growth in China as well as a strengthening U.S. dollar, Valentin Marinov, G10 currency strategist at Citi told the Global MarketsForum, a Reuters online community.

In the very near term though, he said, the Aussie could squeeze a bit higher. That was primarily because plenty of investors and speculators had built large bets against the currency and needed to book profits, analysts said.

Dollars & Cents

Dollars & Cents


U.S. equities sold off today along with the dollar as money left the U.S. and went to the eurozone on better than expected factory orders. The move pushed equities back to support as well as the dollar. We will watch for this support area to hold as it is likely a knee jerk reaction.

The EUR/USD rallied up high enough to stop us out of our trade at breakeven but price did not close through 1.33 which has been acting like strong resistance. This may be a good place to take another short but the price action over the past two weeks has been volatile. We will wait for a new clearer entry signal. (see EUR/USD below)


The CAD/JPY dropped suddenly on the sell-off of the markets and higher volatility. The drop triggered our buy limit and we are in the trade. We will watch for another buy limit at the trend line and look for a higher low for an opportunity to tighten the stop. (see CAD/JPY below)


The USD/CHF edged lower today, not enough to break near term support but enough to have us looking for a bullish entry. We are setting a buy limit at 0.9185 with a stop loss of 0.9135 and two contracts. (see USD/CHF below)

S&P 500 August Performance 1992-Present


From recent posts and Almanac Alerts, it is know that August has been the worst performing month of the year since 1987 with DJIA and S&P 500 recording average declines of 1.0% and 0.8% respectively. Deeping deeper into data reveals that the first nine trading days of August (since 1992) have an even weaker record than the entire month. In the last 21 years, the S&P 500 has been down 13 times with an average loss of 1%. However, with the S&P 500 up 1.3% through today’s close, history is on the market’s side. There have been 11 positive starts in 21 years. Of these 11, all but three proceeded full-month gains.

Monday, August 5, 2013

Planetary Alignments & Astro *Carto* graphy


Dollar Falters, S&P 500 Reversal Risk Remains

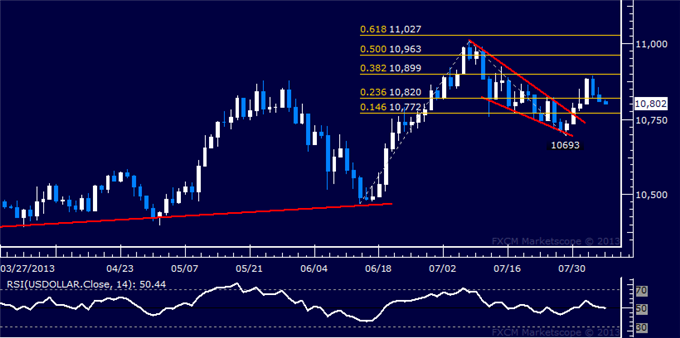
US DOLLAR TECHNICAL ANALYSIS – Prices slipped back below the 23.6% Fibonacci expansion at 10820, exposing the 14.6% level at 10772. A further push below that eyes the July 29 low at 10693. Alternatively, a move back above 10820 targets the 38.2% expansion at 10899.
Forex_Dollar_Falters_at_Chart_Barrier_SP_500_Reversal_Risk_Remains_body_Picture_5.png, Dollar Falters at Chart Barrier, S&P 500 Reversal Risk Remains
Daily Chart - Created Using FXCM Marketscope 2.0
** The Dow Jones FXCM US Dollar Index and the Mirror Trader USD basket are not the same product.
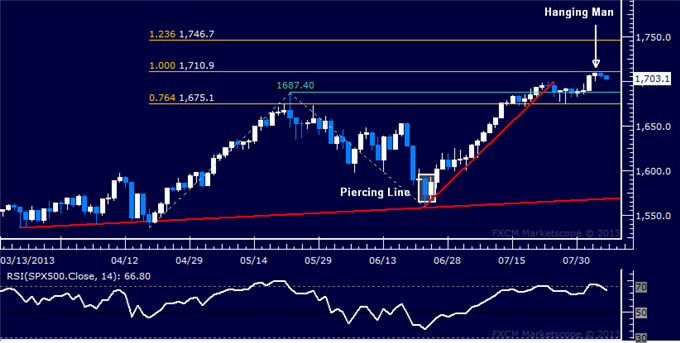
S&P 500 TECHNICAL ANALYSIS – Prices put in a Hanging Man candlestick below resistance at 1710.90, the 100% Fibonacci expansion, hinting at indecision and warning a turn lower may be ahead. Near-term support is at 1687.40, the May 22 high, followed by the 76.4% Fib at 1675.10. Alternatively, a break above resistance aims for the 123.6% Fib at 1746.70.
Forex_Dollar_Falters_at_Chart_Barrier_SP_500_Reversal_Risk_Remains_body_Picture_6.png, Dollar Falters at Chart Barrier, S&P 500 Reversal Risk Remains
Daily Chart - Created Using FXCM Marketscope 2.0
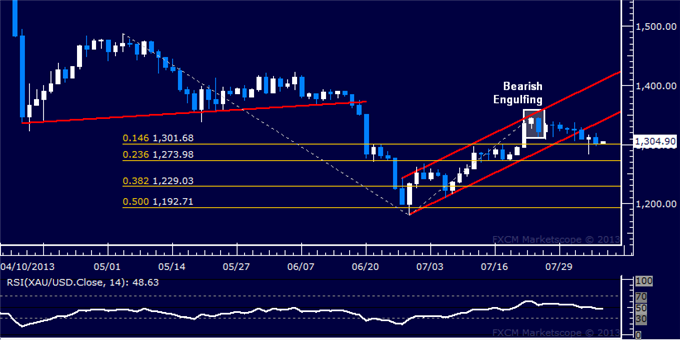
GOLD TECHNICAL ANALYSIS – Prices broke lower as expected after putting in a Bearish Engulfing candlestick pattern below resistance at the top of a rising channel set from late June. Sellers are now challenging the 14.6% Fibonacci expansion at 1301.68, with a break below that exposing the 23.6% level at 1273.98. Channel bottom support-turned-resistance is now at 1341.47.
Forex_Dollar_Falters_at_Chart_Barrier_SP_500_Reversal_Risk_Remains_body_Picture_7.png, Dollar Falters at Chart Barrier, S&P 500 Reversal Risk Remains
Daily Chart - Created Using FXCM Marketscope 2.0
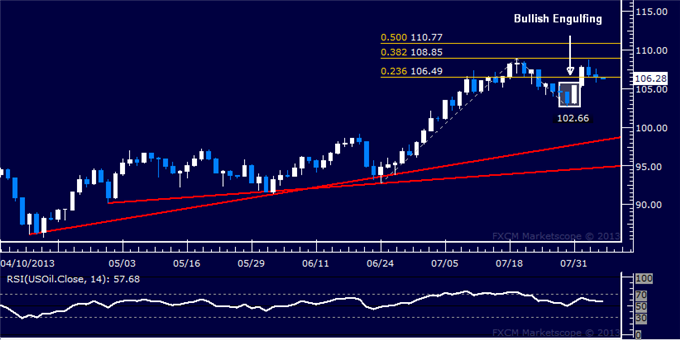
CRUDE OIL TECHNICAL ANALYSIS– Prices advanced as expected after putting in a Bullish Engulfing candlestick pattern. A break above initial resistance at 106.49, the 23.6% Fibonacci expansion, has exposed the 38.2% level at 108.85. A further push above that aims for the 50% Fib at 110.77. The 106.49 mark has been recast as near-term support, with a reversal back beneath that eyeing the July 30 low at 102.66.
Forex_Dollar_Falters_at_Chart_Barrier_SP_500_Reversal_Risk_Remains_body_Picture_8.png, Dollar Falters at Chart Barrier, S&P 500 Reversal Risk Remains
Daily Chart - Created Using FXCM Marketscope 2.0

Tuesday, July 23, 2013

Planetary Alignments & Astro *Carto* graphy


Dollars & Cents

Dollars & Cents


Equities pulled back very slightly after a bullish open today with the markets trading on light volume. Earnings reports are generally positive but not stellar and the markets are stoic in their response. The dollar index traded back to near term support and paused.

The EUR/USD gained more today, moving to the near term resistance level as discussed in yesterday’s newsletter. Historically, the close prices have remained near 1.3250 as resistance while the shadows have pushed 1.33 and then 1.34. Thursday is likely to be a bullish day in the equity market and this pair has some room to be a little more bullish before selling off. (see EUR/USD below)


The USD/CAD continues to fall and rising oil prices are accelerating this pair to the downside. We are watching for price to drop to trend support. If priced breaks through 1.0250, we will likely set a buy limit at trend support near 1.0150. (see USD/CA below)


The GBP/CHF traded relatively flat again today, closing within a few pips of the past 3 day closes. We will watch for a bullish close tomorrow and move up our stop from break even to profitability. (see GBP/CHF below)

Market LookBeck II

(Reuters) - The dollar was broadly weaker on Tuesday, falling to a one-month low against the euro in thin trading, as investors continued to scale back bullish bets on the greenback on the view that the Federal Reserve could reduce its asset-buying program later than expected.

Fed Chairman Ben Bernanke told lawmakers last week the U.S. central bank still expects to start reducing its massive bond purchase program later this year, but he left open the option of changing that plan if the economic outlook shifted.

"In the absence of any economic news, positioning has been driving the FX market," said Brian Dangerfield, currency strategist at RBS Securities in Stamford, Connecticut.

"The market is still quite long dollars and in quiet periods like today, traders are scaling back their positions especially in the wake of what Bernanke said last week."

Investors had accumulated dollars the last few months as Bernanke suggested in May that the Fed could start winding down its stimulus plan later this year. A reduction in the Fed's bond purchases would be positive for the greenback because it means that the U.S. central bank won't be flooding the market with dollars as much.

The euro rose to $1.3238, its highest level since June 21, as some investors pushed it to the 50 percent Fibonacci retracement of the move from the early April low to the mid-June high. It was last at $1.3225, up 0.3 percent on the day, rising for a third straight day.

Investors are looking to the flash Purchasing Managers' Index data on Wednesday as worries about euro zone economies are re-emerging. Analysts said there would probably be selling into any rebounds in the euro.

Trading "is more of a technical move in an otherwise very thin market amid generally soft data and questions on the timing of tapering," said Omer Esiner, chief market analyst at Commonwealth Foreign Exchange in Washington.

Bernanke's dovish remarks have emphasized that the U.S. central bank's bond buying will continue in some form and interest rates are likely to remain low for the foreseeable future.

Benchmark yields have fallen as other top Fed officials have stressed that the timing of any reduction in the central bank's $85 billion monthly asset purchases would depend on economic data.

As a result, along with some weaker-than-expected U.S. data, the dollar has sold off to key support levels. Further downside will require another round of bad data, analysts said.

"The market is getting comfortable with the idea that tapering is not tightening," said Sean Cotton, vice president and foreign exchange advisor at Bank of the West in San Ramon, California.

The dollar index was last down 0.3 percent at 81.983. It fell to 81.926, also its weakest since June 21.

Analysts, however, said the dollar would likely strengthen in the coming months against currencies such as the euro, sterling and the yen because the Fed is expected to be the first major central bank to make its policy less accommodative.

But few anticipate the dollar's rise to be smooth.

Benchmark U.S. 10-year Treasury yields, which have had a robust correlation with the dollar index, have slipped in recent weeks. They last stood at 2.507 percent, slightly up on the day but well below the 2.755 percent hit on July 8, their highest since August 2011.

The dollar was down 0.2 percent against the yen at 99.43 yen, recovering from a one-week low of 99.13 yen earlier.

Analysts said Japanese Prime Minister Shinzo Abe's decisive upper house election win last weekend would pave the way for pro-growth fiscal policies and for further Bank of Japan monetary easing, which would weaken the yen.

The dollar was up more than 15 percent versus the yen this year, and the recent slide in dollar/yen has likely bottomed out, according to trends in the options market.

Analysts said the beginning of holidays has reduced volumes and volatility, which could result in most currencies trading in ranges. Some $3.99 billion in euros had changed hands, according to Reuters Dealing data on Tuesday, and $2.06 billion in yen

Market LookBeck

MONTHLY - Neutral. Opposing tails on large hammer candles with excess to upside and then downside.

WEEKLY - Bullish. Closed weekly bar at new all-time high.

DAILY - Bullish. Continued new all-time highs with lack of stronger liquidation break. Long risk remains elevated.
Good morning traders. The inverse correlation between the U.S. Dollar (/DX) and the broad stock market has re-emerged as of late. Please observe the chart below.


The daily candlestick chart of /DX versus the daily line chart of the S&P 500 Index (SPX) is reflected on the chart above. The green arrows point to the price action of both asset classes on 07/11/13. This is the point at which a distinct inverse reaction to /DX was demonstrated by SPX. The pattern has continued since.

Looking ahead, the does not come into any technical support until the 200 day moving average (blue line), and then the prior low at 80.615. If /DX is destined to reach either of these support points, and the inverse relationship between /DX and SPX continues, further decline by /DX will provide confirmation of a continued grind higher by stocks.

Dow Jones Industrial Average 15567.74 22.19 0.14%
S&P 500 Index 1692.39 -3.14 -0.19%
Nasdaq Composite 3579.27 -21.11 -0.59%
Nasdaq 100 3031.39 -23.82 -0.78%
Russell 2000 1052.20 -1.20 -0.11%
Spot Gold 1342.75 8.75 0.66%
Crude Oil 107.47 0.52 0.49%
NYSE Overall Volume 3,115,871K n/a 12.10%
Nasdaq Overall Volume 1,621,051K n/a -8.61%
NYSE Breadth 1.33 : 1 positive
Nasdaq Breadth 1.73 : 1 negative
NYSE Breadth Ratio 57.06
Nasdaq Breadth Ratio 36.69
NYSE Advancers/Decliners 412
Nasdaq Advancers/Decliners -164
NYSE Trin 0.99
Nasdaq Trin 1.50
$VIX 12.66 0.37

                                       ES
                         NQ
Value Area High 1690.50 3045.00
Point of Control 1688.50 3034.50
Value Area Low 1687.00 3030.00
R3 1700.83 3076.83
R2 1697.42 3065.67
R1 1692.83 3045.83
Pivot 1689.42 3034.67
S1 1684.83 3014.83
S2 1681.42 3003.67
S3 1676.83 2983.83

ShadowTrader Sector Trend Scores


Nineteen ShadowTrader Sectors closed lower on Tuesday whild six ended higher. The broad market is neither overbought nor oversold at this juncture. SOX is the only sector approaching an overextended condition having closed lower each of the last four days.

Technical Analysis Daily /ES


LBR Studies (Linda Bradford Ratchke, LBR PaintBar, LBR_SmartADX, LBR_ThreeTenOscillator)
DMI Studies (DMI Reversal Alert, DMI Oscillator, DMI StochasticExtreme, SequenceCounter, ZigZagHL)
FW Studies ((David Elliot, MOBO, FW_CCI, FW_FisherTransformer))
Bill Williams Profitunity Studies (Alligator, Elliot Oscillator, Awesome Oscillator)
IRSTS Studies (Sylvain Vervoort, Volatility Bands, BollingerPercentB, Stochastic, ZigZagSign)
Woodies Studies (LSMA, 34EMA, WoodiesPivots, WoodiesCCI, HLTicks, PivotsTicks)
CynthiaE Studies (DoubleMoving Average, ErgodicOscillator, DoubleStochastic, PPS)
Mobius Studies (TTM SqueezeWave, BollingerPerecentB, PSAR, TMV, Stoplight, TTM_LRC, PFEaRSI)

Please Contact for Custom ThinkScripts, glad to share with all...

Technical Analysis Hourly /ES


LBR Studies (Linda Bradford Ratchke, LBR PaintBar, LBR_SmartADX, LBR_ThreeTenOscillator)
DMI Studies (DMI Reversal Alert, DMI Oscillator, DMI StochasticExtreme, SequenceCounter, ZigZagHL)
FW Studies ((David Elliot, MOBO, FW_CCI, FW_FisherTransformer))
Bill Williams Profitunity Studies (Alligator, Elliot Oscillator, Awesome Oscillator)
IRSTS Studies (Sylvain Vervoort, Volatility Bands, BollingerPercentB, Stochastic, ZigZagSign)
Woodies Studies (LSMA, 34EMA, WoodiesPivots, WoodiesCCI, HLTicks, PivotsTicks)
CynthiaE Studies (DoubleMoving Average, ErgodicOscillator, DoubleStochastic, PPS)
Mobius Studies (TTM SqueezeWave, BollingerPerecentB, PSAR, TMV, Stoplight, TTM_LRC, PFEaRSI)

Please Contact for Custom ThinkScripts, glad to share with all...

dWb__ShadowTrader Quad


S&P 500 Futures Technical Analysis